With features extracted from BAFET, some regulations can be found through 162 image sets aging from 57 to 85.
1. Total length
This feature is the sum of all vessels in a image set, which is a direct information about vessel richness. Compare total length (y) with different age (x) and fit the relation with a linear model. The tread line can be calculated as y = -38.916x + 6180, which means an average of 38.916 pixels (13.681mm) of length is decreased through a year.

The relation of total length(y) and age(x)
2. Number of Branches
Number of branch describes the intricacy of small vessels. The main artery structure and main bifurcation of brain is the same, so image set with higher number of branches means more small vessels are linked in an artery.
Compare number of branches (y) with different age (x) in a similar method, the tread line is calculated as y = -0.8912x + 123.02, which means an average of 0.8912 branch will disappear annually when aging.

The relation of number of branches(y) and age(x)
3. Total volume
Total volume is a better feature than total length in describing vessel radius as well as vessel length. Not only small vessels may disappear when aging, the thickness of vessel may also change. I find the volume will decrease 1226.1 pixel^3, (53.276 mm^3) annually. Compare the decrease percent per year (0.762%) with total length (1.143%), the decrease in volume is lower, which may be resulted from the main artery stability (even 85 years old have long and thick artery vessels) and its large proportion (artery radius is several times larger than radius of small vessels)

The relation of total volume(y) and age(x)
4. Length of each order
From the different decrease rate of total volume and length, I suppose the main artery will not decrease much but the small vessels in high order will decrease dramatically. To have a better look, I analyze the total length of vessel in each order group.
1st (Order 1, usually located on main artery up to first bifurcation) Length: y = 1.6055x + 315.15
2nd (Order 2,3, usually describe horizontal vessels from first bifurcation to small vessels) Length: y = 3.7531x + 209.14
3rd (Order 4,5, usually describe small vessels linked from artery or large vessels, but not too small) Length: y = -1.9145x + 894.16
4+ (Order 6+, usually in the end of tree, smallest vessels in a brain) Length: y = -42.518x + 4769.5
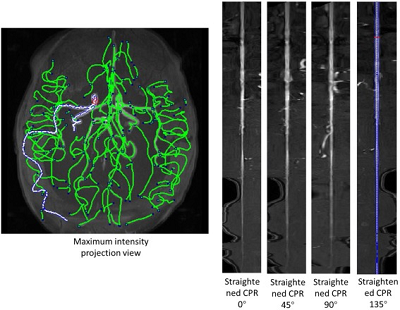
Here is a typical image illustrating location of vessels

Typical vessel painted in Order
The result of 1st and 2nd length means there is an increase in length through age, but the increase rate is 0.047% and 0.110% respectively, which is enough low to be ignored. The increase may result from fewer branches in 3rd order group, which makes 2nd Order group longer. From the 3rd length, the slope starts to decrease, meaning a fading of vessel through age. The 4+ length is the main reason of the decrease in total length (1.248% decrease annually)
From these result, it is compelling to know the disappearance of small vessels are the main phenomenon in aging.


Length(y) change though age(x) in different Order
5. Intensity
still working on...
The regulation of feature change in topology as well as in intensity through aging is found. The result is revealing and striking. It can be concluded that vessel is shrinking or disappearing when aging, especially to small vessels far from artery seeds.
However, the calculation has many problems and based on many assumptions, which is discussed in Problems in data and calculation.
admin1
memeda
ssy
 Login
Login