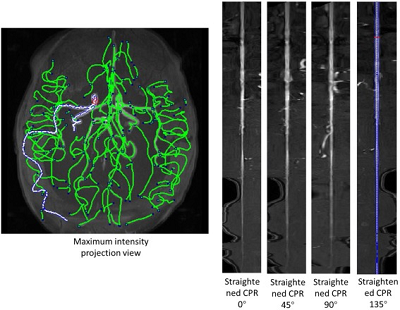
After we have gotten vessel seeds in 3D image according to DSA time information, we need to visualize the vessels using different color to show a nicer view.
To simplify, we propose the following assumption.
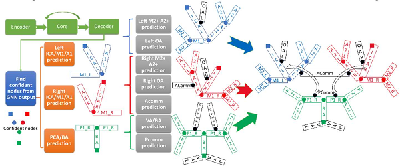
1. Vessels flowing away from the vein seeds are pure blue RGB(0,0,255)
2. Vessels flowing towards the artery seeds are pure red RGB(255,0,0)
3. Vessels located between vein and artery seeds are in gradual color between pure blue and red according to the distances between seed positions.
4. Brain vessels are transformed into node graphs. Each vessel area center of each layer is represented as a node, if vessel area centers in two adjacent layers have common areas in X-Y plain, then these nodes are connected together.
5. Distances are calculated by the shortest path route between two nodes, marked as Da (to the nearest artery seeds) and Dv(to the nearest vein seeds)
6. Gradual color red channel is defined as 255*Da/(Da+Dv), blue channel is defined as 255*Dv/(Da+Dv)
Matlab code are following such assumptions.
Extract node center in each layer to build a node graph->search each nodes and calculate distance Da and Dv ->calculate color to paint->save 2D images->reconstruct in ImageJ
Code are open in github: https://github.com/clatfd/avm/blob/remote/paint.m

After painting color
This is a part of my Capstone Research.
admin1
memeda
ssy
 Login
Login